Claira
Employee-Role Comparison Tool
Overview
Problem:
Claira’s employee-role comparison tool (RYG) is not widely used by it’s intended audience, mid-level managers, due to the limited functionality and low perceived value.
Goal:
Design a single page, multi-functional dashboard to include employee profile information, RYG visualization, and drill down data to for management to easily conduct performance reviews and identify qualified talent for business needs.
Solution:
Addressed how to make the complex matching of competencies easily digestible for users while fostering a simplified yet detailed interface that can help management make quick and informed decisions about their workforce.
01. Project Overview
Claria.ai is a competency analytics engine to help companies better understand their workforce and hire more effectively. There are three main users groups for companies who purchase Claira:
Buyer: The individual who purchases Claira
Admin: Managers who access dashboard data and tools
Employee: Complete onboarding quiz to gauge competencies
We were tasked with redesigning the competency comparison tool in the admin dashboard – which means we focused on mid to high level management for our user base. The purpose of the employee-role comparison tool is to help managers align talent with company needs, whether that be project or role based. The tool also serves as an employee development resource for managers to see gaps in their direct report’s skills in their current role.
Our goal is to improve the usability of the tool while adding additional value to its purpose for managers.
We want to foster a simplified yet detailed interface that can help management make quick and informed decisions about their workforce.
02. Project Scope
Claria’s mission is to change how organizations understand their people using competency science. However, this high-level idea is not so easily translated to customers using the interface itself. Therefore, our main problem is to address how to make the complex matching of competencies easily digestible for users.
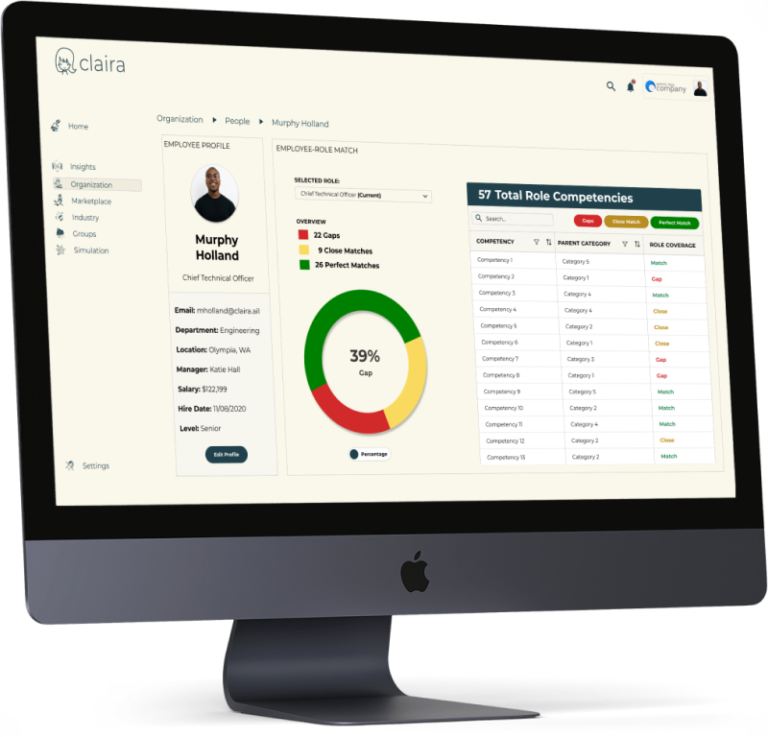
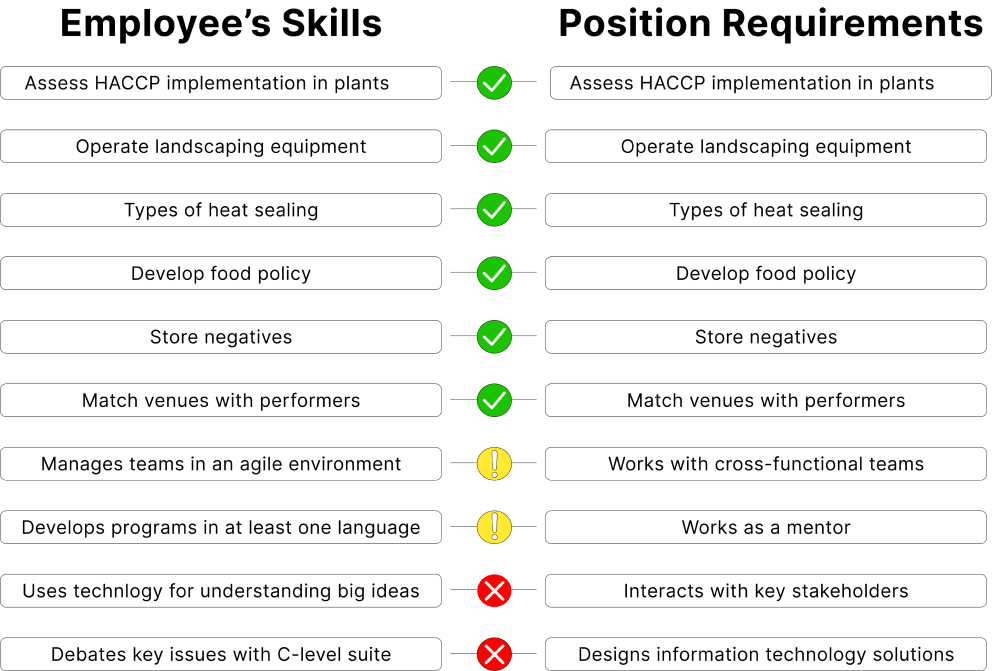
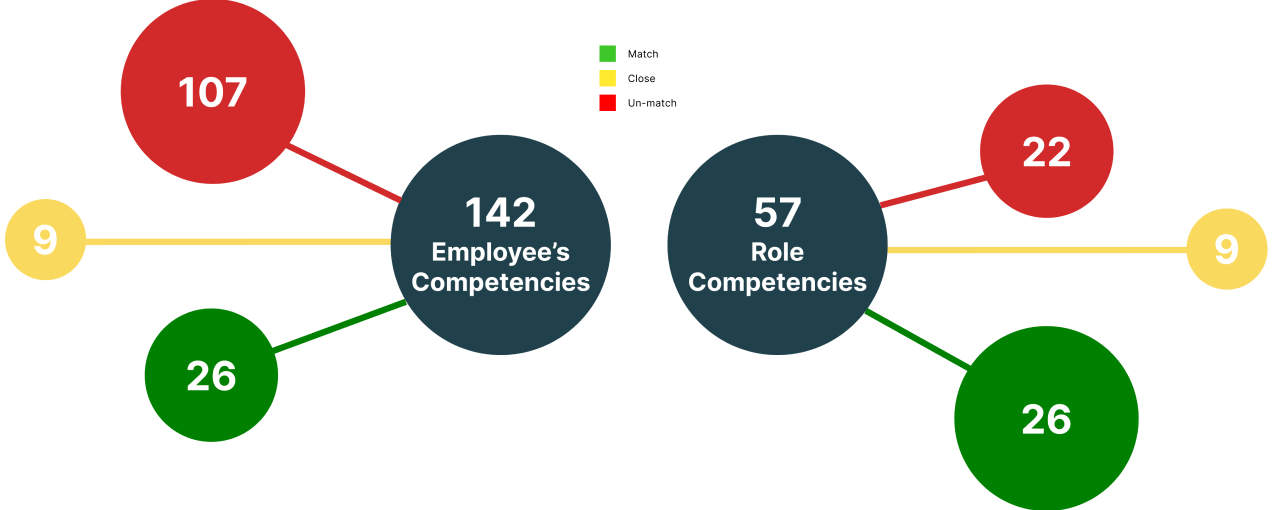
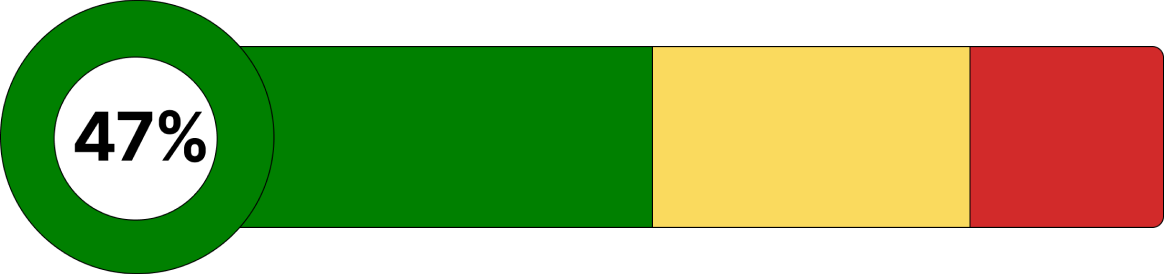
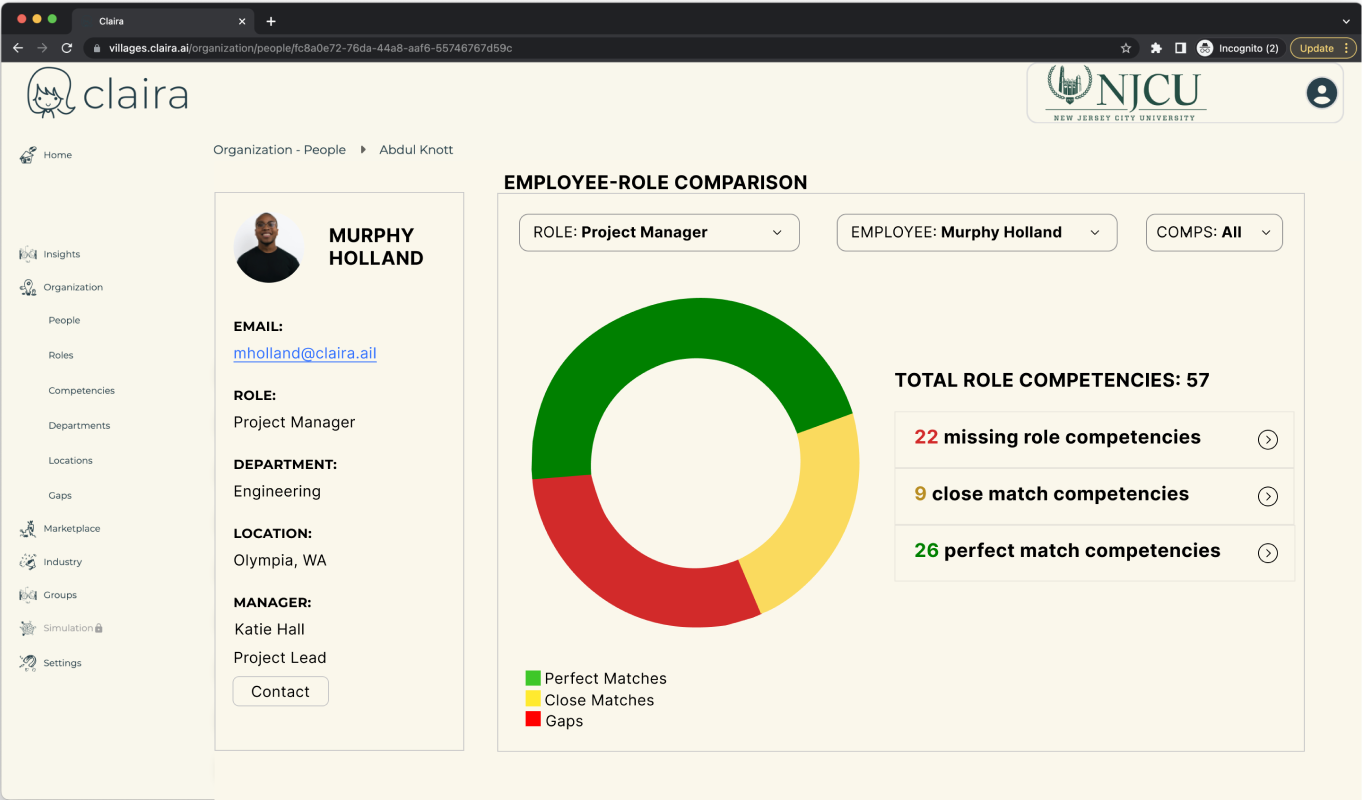
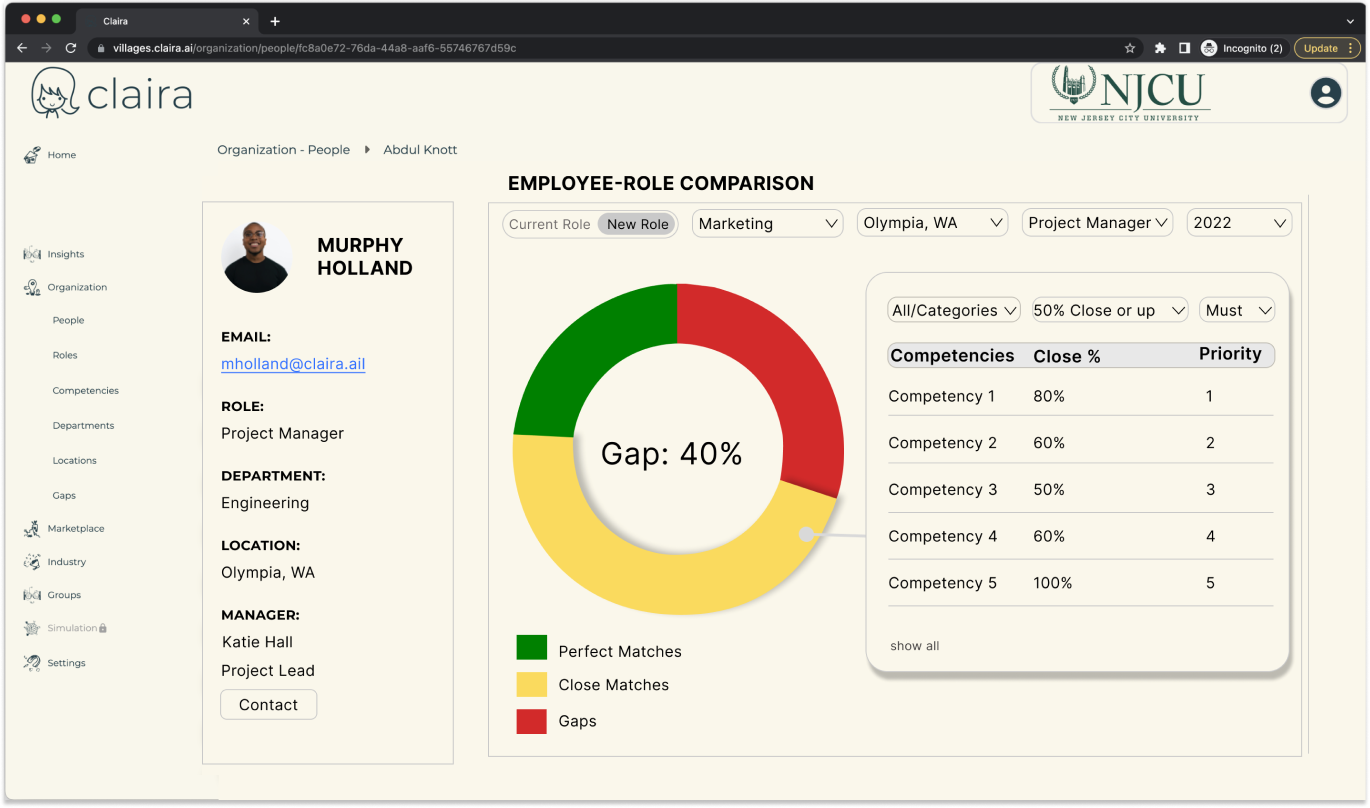
The screen below is Claira’s current employee-role match page. The concept is to compare the competencies of an individual to a role then display the results as either green (Perfect Match), yellow (Close Match), or red (Gaps/Untapped). Claira calls this concept the “RYG” visualization due to its color choice in role coverage. The RYG tool requires only one employee and one role to be selected for comparison.
Claira’s Current RYG Page:

03. Roles & Constraints
My team, consisting of 5 UX designers, initiated the establishment of team roles for the coming weeks to keep each other accountable and stay in sync. My primary role was to manage the project. Tasks I completed included finalizing deliverables, creating and adhering to the project timeline, organizing and leading team meetings, and dividing work amongst the team with deadlines. From research to production, the project timeline was 10 weeks. This time constraint limited the scope of work we were able to produce.
Given all team, client, and user interactions were conducted digitally, it was also important for us to decide what tools we would use for tasks up front:.
- Trello: Project Management Tool
- Miro: Team Workshop Space
- Google Drive: Formalized Deliverables
- Figma: Asset Creation & Prototypes
04. Users & Audience
The main user group using the RYG tool are mid-level managers who lead up to 50 employees max. Their priority with the tool is to discover what their workforce can and cannot do for the needs of the business. Depending on the organization, managers typically visit the platform once a week, quarter, or year. Our goal is to add value to the tool and increase usability for management to easily conduct performance reviews and identify qualified talent for business needs.
05. Problem Statement
Platform needs provided by the client:
- Too Much Scroll: The current design makes it difficult for managers to see all the competencies for an employee or their role.
- No Summary of Data: There is no quick way for a manager to understand an employee’s overarching situation or how they align with a role.
06. Approach
Our approach included the following phases and deliverables:
Discovery
Claria Resource Audit
Research
User Interviews
Analysis
Persona
Task Flows
Concepting
Production
RYG Concepts & Test Script
Mid-Fi Wireframe Concepts
Convergence Plan
Discovery
Claria Resource Audit
My team and I were given a general walk-through Claira’s admin dashboard along with screenshots and wireframes of upcoming sprint iterations to the RYG page. There were two main goals identified for managers using the tool: employee development and hiring employees for open roles or projects.
Manager's goals:
employee development and
hiring employees
Research
We started with domain and competitive research to better gauge the industry and data visualization best practices. We quickly discovered that Claira’s approach of using competency science is unique. There are no other companies using competency science to match employee skills to organization needs. Therefore, traditional human capital tools like Workday and Greenhouse are considered direct competition, despite lacking this key component to Claira’s founding. This was important to our understanding of the industry and Claira’s unique advantage.
User Interviews
After our initial research, our next priority was to conduct user interviews with managers of varied fields to better understand what employee data they find most valuable for hiring and employee development.
| User | Industry | Employees | Hiring | Employee Dev. |
|---|---|---|---|---|
| 1 | Manufacturing | 12 - 40 | High | High |
| 2 | Big Tech | 0 | Medium | High |
| 3 | Finance | 7 | High | High |
| 4 | Medical | 20 - 60 | High | High |
We focussed on sourcing managers that fell within our primary user’s criteria provided by the client. This included leading a team of approximately 50 or less employees and being directly involved with employee development and hiring. We were able to source 4 users from different industries for our research test.
Key insights
After analyzing manager feedback, we were able to notice recurring frustrations such as the time commitment to hire and develop employees. When asked about employee data utilized for these two goals, all of our users attributed the most valuable data being that which reflects the employee’s “impact”. We noted the ambiguousness of this term, seeing as it can have different interpretations based on industry standards or organization’s specific metrics.
We also found that managers have difficulty targeting an employee’s untapped skills. Most interviewees stated there was no system or process in place to assist them in discovering these skills. Additionally, it is uncommon for performance metrics to encompass an individual’s soft skills. Claira’s competency library covers both untapped skills and soft skills, therefore these areas need to be emphasized for the user to be able to extract value from the RYG tool.
Analysis
Persona
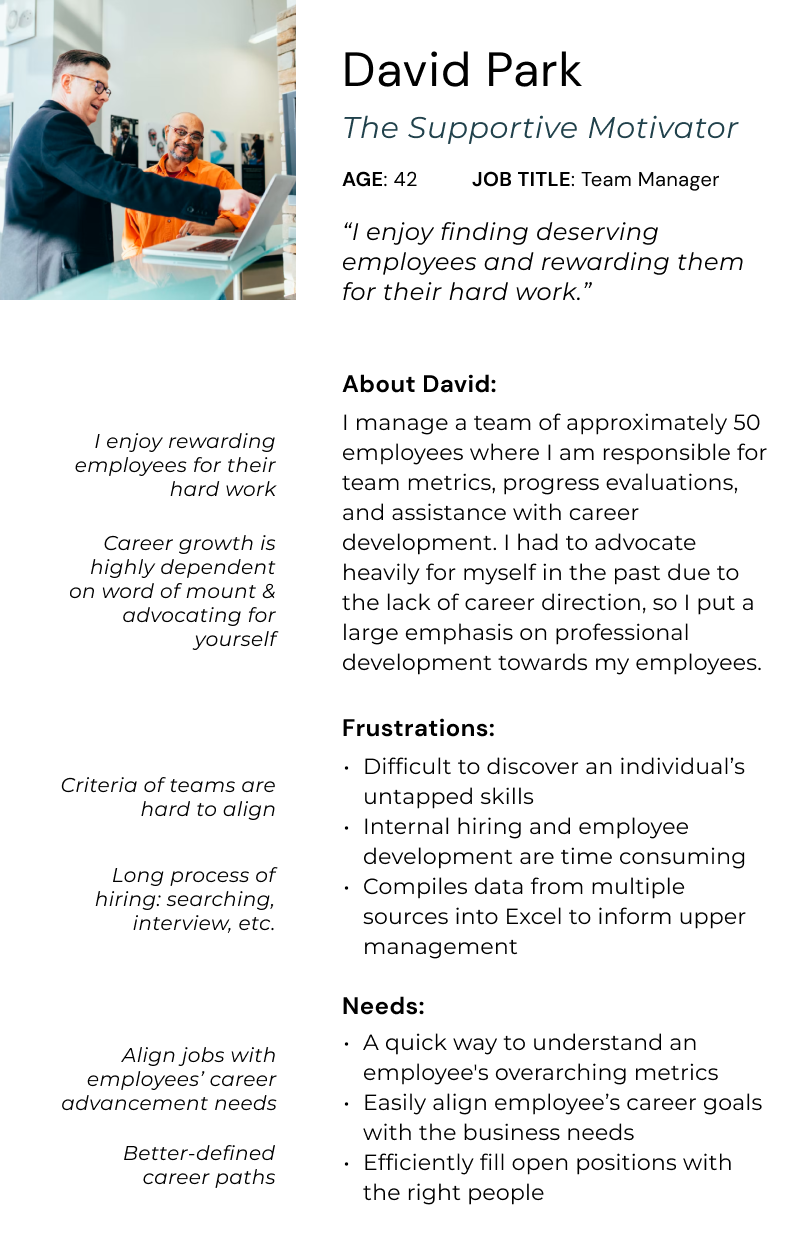
Incorporating user feedback with our research and understanding of Claira’s typical user base, I began to form our persona – David Park.
You can see the user interview data directly influenced David’s behaviors, frustrations, goals, and needs.
As “The Supportive Motivator” archetype, David’s focus is on the development of his employees, which includes aligning his direct report’s skills towards the needs of the business. He needs a quick way to understand an employee’s overarching situation so he can accurately convey one’s performance and reduce time spent. The tool needs to capture an employee’s potential through untapped and soft skills to meet his needs.
Task Flows
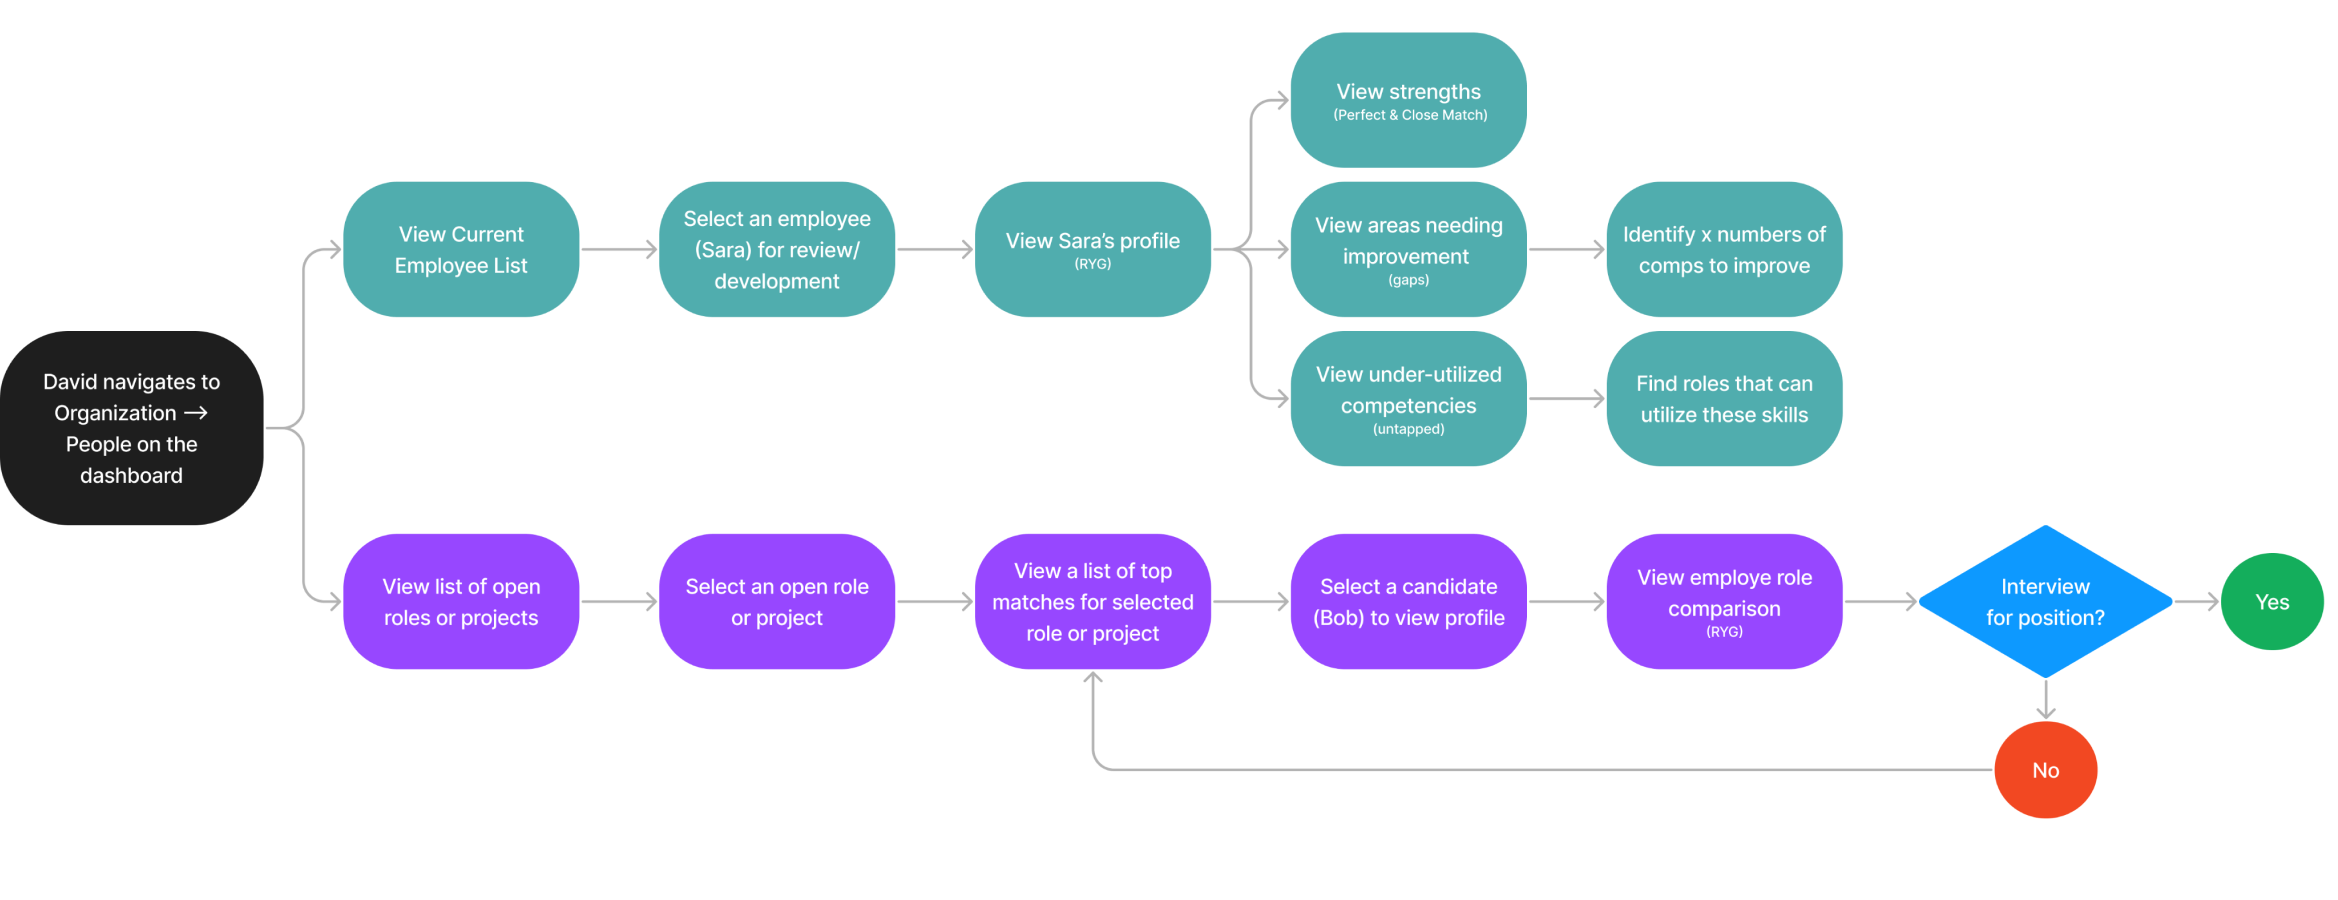
To gain a better understanding of what David would need to view and make decisions, we began creating his task flow.
As identified, employee development and hiring are the two major reasons David would utilize the RYG tool. Therefore, we divided these into separate task flows: Employee Development/Review and Hiring for a Position/Project.
- In this flow, David wants to see both untapped competencies to better utilize an employee’s skill set, in this example “Sarah”.
- He also will need to view the employee’s competency gaps in order to develop any missing skills for her current role.
- For this task, David is not interested in the potential candidates’ untapped competencies. He cares more about how a candidate compares to the open role, aka perfectly matched(green), close matched(yellow), and gaps (red).
- It would be helpful for David to view a list of employees or roles prior to the RYG data available on a selected employee’s profile.
See below for visuals.
Concepting
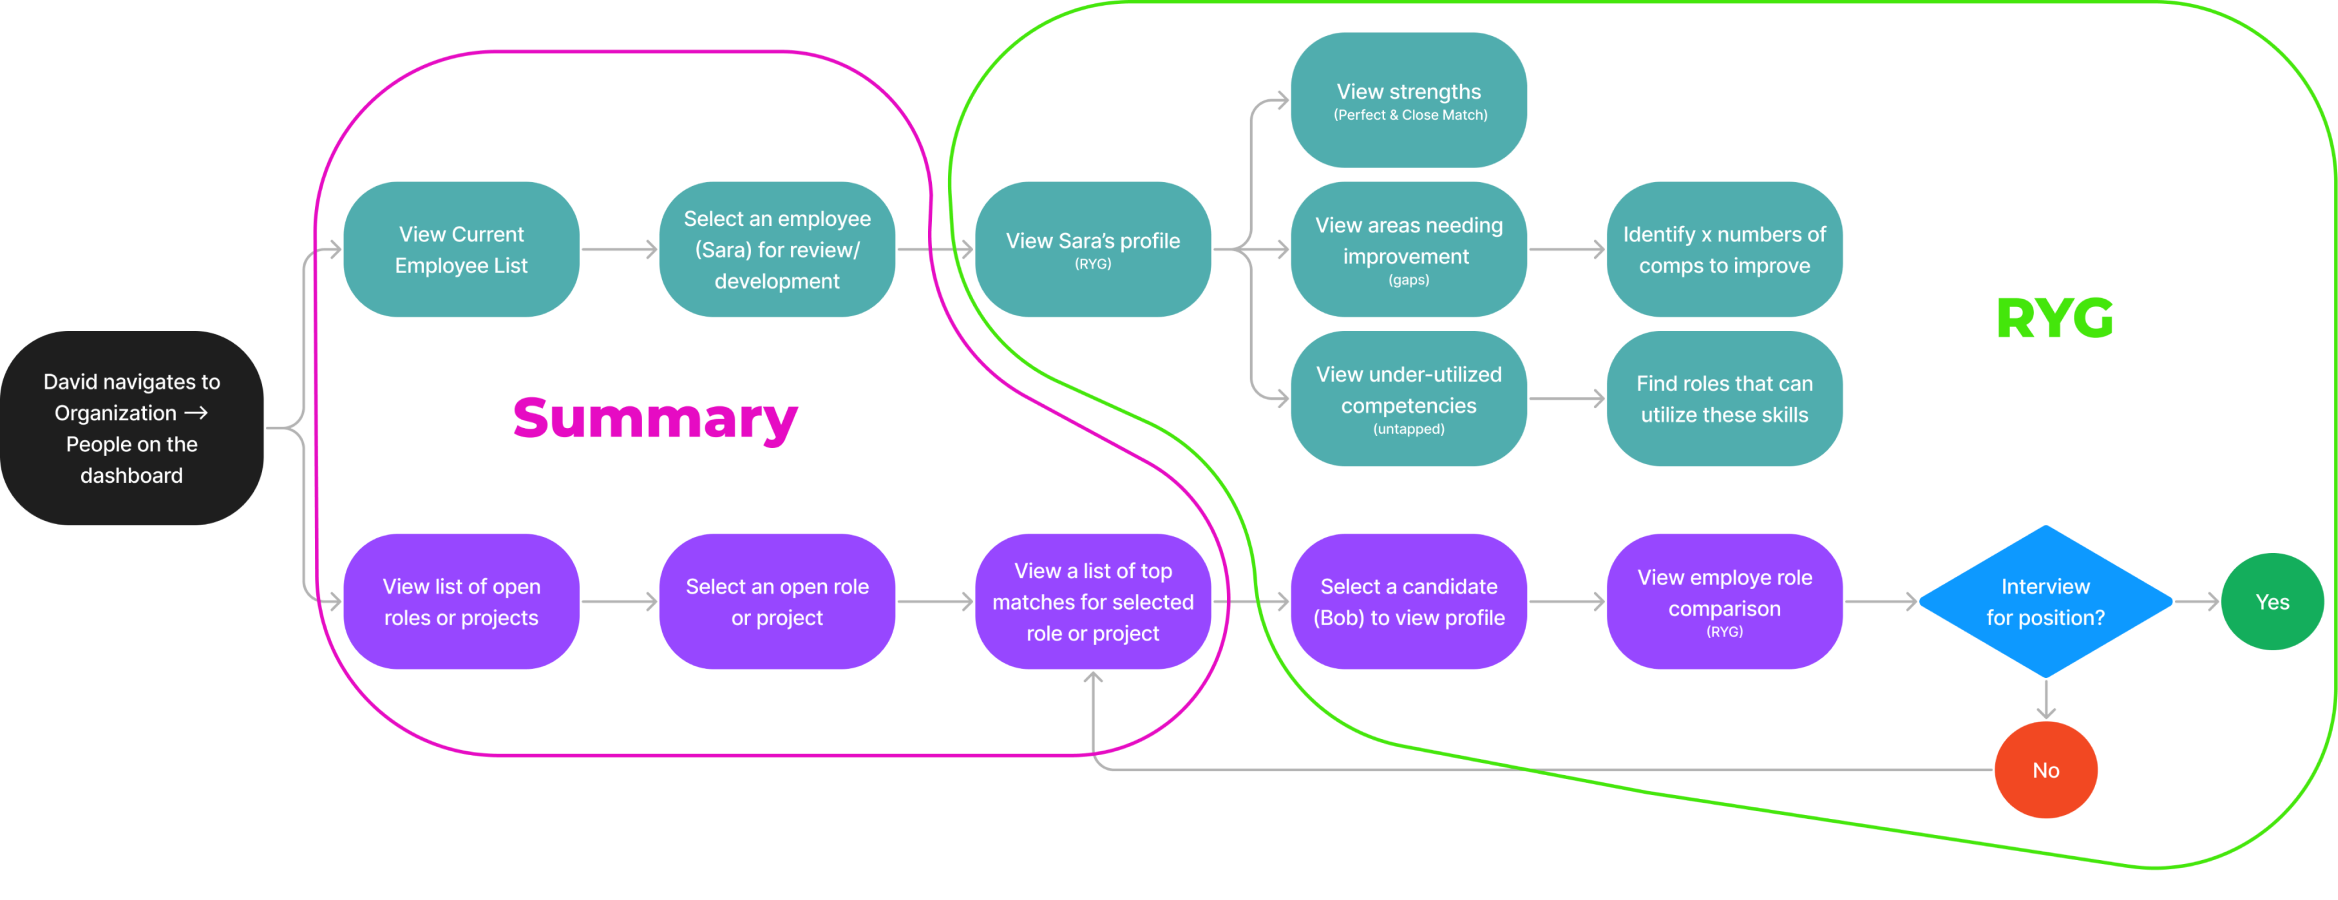
After gaining a better understanding of David’s path using the RYG tool, we analyzed the task flow to clearly define what views would be necessary to accommodate his needs.
The screen preceding the employee profile (which contains RYG tool) is a list of all the employees within an organization and therefore not providing value. We identified a missing summary view where David would be able to see a quick view of his employee’s competencies, recommended candidates for open positions, and more. This “Summary” view would give David at-a-glance information to make quick decisions while also allowing for him to easily navigate into an individual’s RYG comparison.
The RYG page lives within the employee profile, which includes the RYG visualization and drill down of employee-role competency data. Due to time and resource constraints, our focus for the project remains solely on the RYG tool and not on the preceding summary view. However, this exercise helped further define our scope of work and led us to establish our concept:
David needs an approachable and intuitive employee profile view which includes the RYG visualization and the ability to dive deeper into competency data.
RYG Concepts & Test Script
Before redesigning the employee profile screen, we set our focus on the RYG visualization. The current design is not intuitive due to the inclusion of an employee’s untapped competencies, the skills an employee possesses but are not being used in their role.
The RYG tool works by taking a list of the role’s desired competencies and comparing them to those of an employee. The employee either has a perfect match, close match, or a gap. The employee’s remaining competencies that do not compare to the role are considered “Untapped” competencies. This categorization does not contribute to the role’s overall match percentage with an employee. Therefore, after gathering feedback and discussion with our client, we decided to remove “Untapped” skills from the RYG visualization.
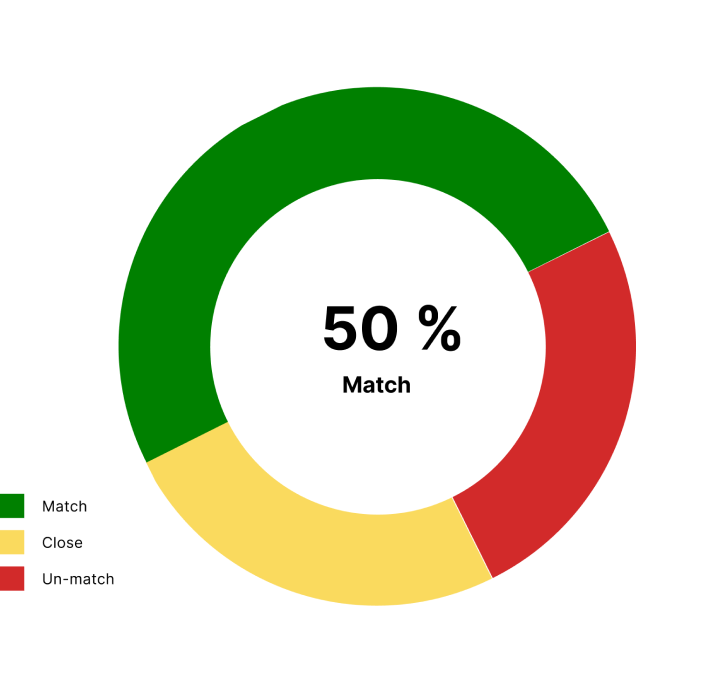
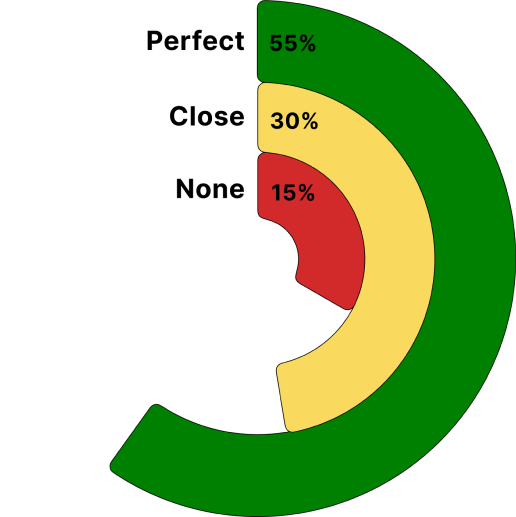
After overcoming this hurdle, we began RYG visualization designs with only perfect match, close match, and gap categorizations. Based on our client’s feedback, we narrowed down to 3 RYG visualization concepts for testing
Claira's RYG Visualizations
Our RYG Visualization Concepts
Mid-Fi Wireframe Concepts
With our 3 RYG visualization concepts complete, we created 4 data drill down flows to accompany the visuals for user testing. Then we conducted user testing with goals to:
- Determine which RYG visualization and/or elements are the easiest to interpret.
- Understand which drill down concept brings the most value to the user.
The following 4 mid-fi concepts with usability test feedback and analysis were used to converge the RYG visualization and data drill down concepts:
Overall, our test confirmed that users were able to understand the meaning of the RYG tool without direction.
Confirmed Assumptions:
- Confirmed the left column to be static as employee data to help eliminate any confusion with the RYG data.
- Filters at the top of the screen allow for familiar visual hierarchy and navigation.
- Simple and minimal design with layers to dig deeper into data helps decrease user fatigue.
Convergence Plan
In addition to the confirmed assumptions, the usability test feedback also provided key elements for convergence of the final most valuable product:
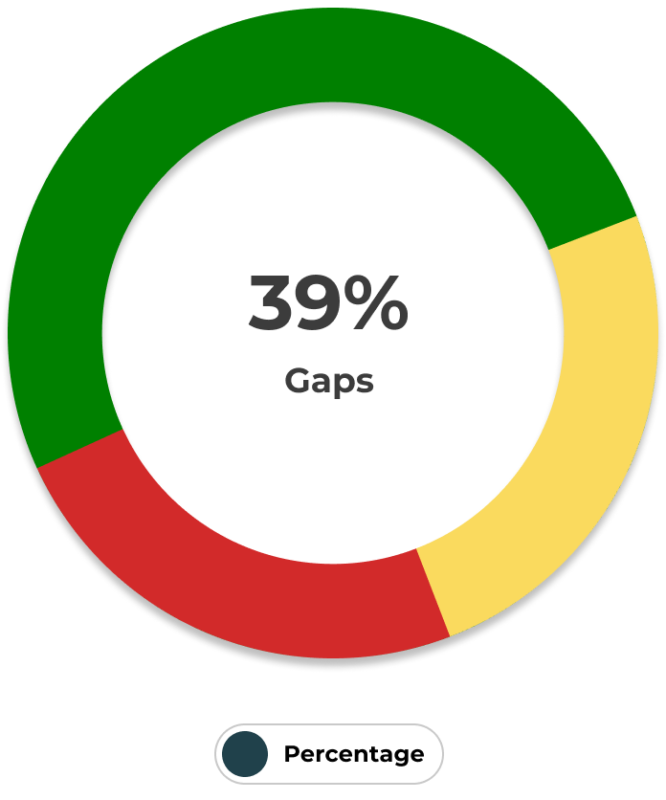
- Overview of data (100%) – quick way to understand the overarching situation in a simple way.
- Doughnut Graph (75%) – selected RYG visualization
- Single page navigation (100%) – remove the scroll
- Clear data labels (100%) – to help clarify visualizations & data
- Hierarchy of filters & sorting functions (100%)
07. Solution
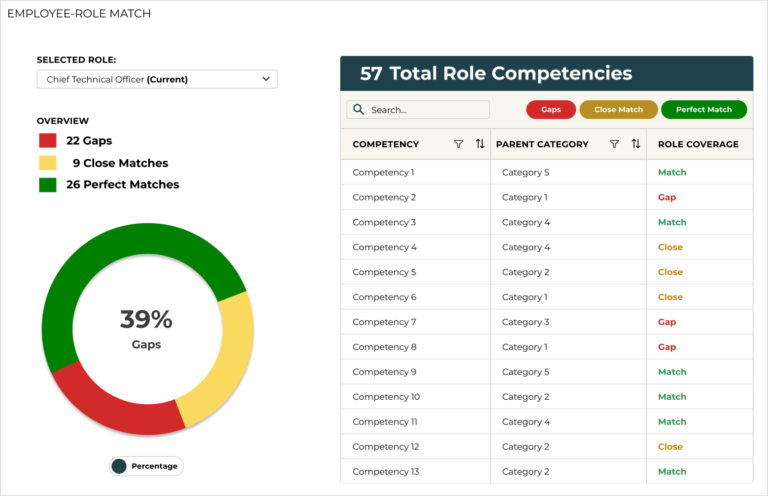
The final MVP contains many sections within one screen to eliminate the user’s need to scroll. The following sections and/or elements are detailed below:
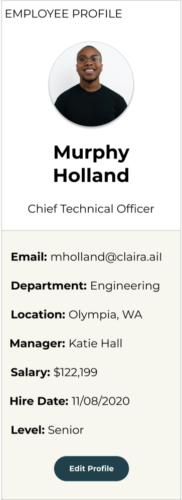
Selected employee from “People” page. Includes employee’s basic organizational data.
Section to house all RYG comparison data and filters for the selected employee.
- “Selected Role” filter defaults to the employee’s current role.
- “(Current)” indicator is added to help clarify this for the user.
- Due to our constraints and scope of the project, we were not able to address any other potential tools on this page
- Left space next to the “Employee-Role Match” title for future additions (untapped competencies, year over year performance, comparison, etc)
Ability to select a different role for employee comparison. Defaults to employee’s current role.
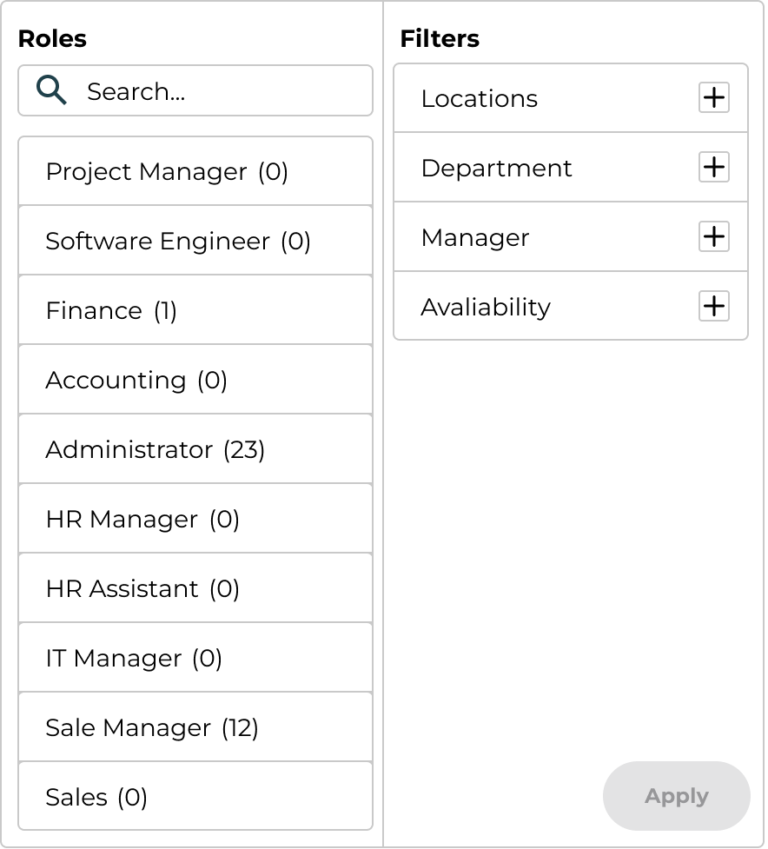
The left column displays all role titles with an integer indication at the end to display availability. The right column offers additional filters to help narrow down role results on the left.
- SEARCH function: User input to find a specific Role.
- Row data has vertical scroll to view all role data within the filter
- FILTERS (Right Column):Categories to filter roles, options include by location, department, manager, and availability.
- EXPAND: Option to expand categories to select sub-categories to filter.
- CHECKBOX: User to select and filter specific sub-categories. This selection filters roles on the left “Roles” column.
- APPLY button:“Disabled” state until a role is selected from the left column.
- FILTERS (Right Column):Categories to filter roles, options include by location, department, manager, and availability.
Filters row data set by categories and/or subcategories.
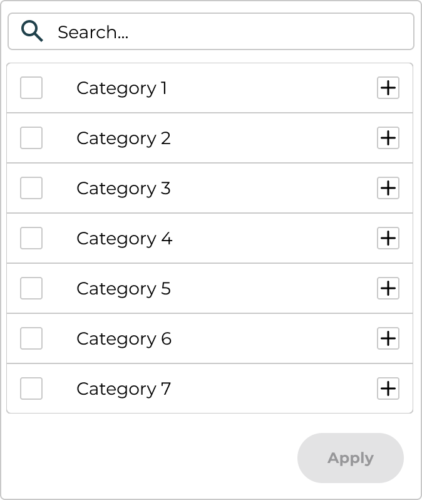
- SEARCH function: User input to find specific category/sub-category.
- CHECKBOX: User to select and filter specific categories/sub-categories.
- EXPAND: Option to expand parent categories to select sub-categories to filter.
- APPLY button: “Disabled” state until at least one category/sub-category is selected.
Always visible quick overview of number of competency gaps, close, and perfect matches for easy access.

- RYG Visualization Doughnut graph “Default” View. Includes Gap % on first view (user interview data confirmed showing Gaps first as it is most prevalent).
- Percent to Ratio Toggle available to switch between formats.
Select and deselect options to filter chart data in the RYG Drill down table.

- The Row Data frame has a vertical scroll to view all data easily within the RYG screen.
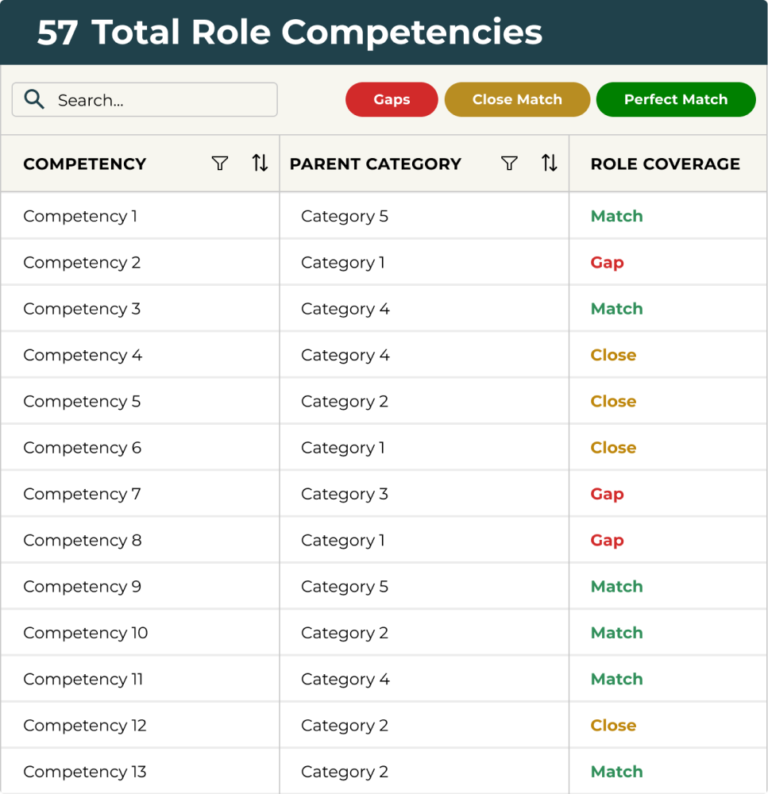
Red-Yellow-Green employee role comparison visualization by selected role and employee profile.
(57 TOTAL ROLE COMPETENCIES):
- SEARCH function: User input to find specific competency/parent category.
- COLUMNS:
- “Competency” = Name of competency
- “Parent Category” = Highest level category
- “Role Coverage” = Gap, Close, Match
- Sort and filter icons for “Competency” and “Parent Category” Columns.
Drill down of employee-role comparison by competency name, category, and role coverage.
(57 TOTAL ROLE COMPETENCIES):
- SEARCH function: User input to find specific competency/parent category.
- COLUMNS:
- “Competency” = Name of competency
- “Parent Category” = Highest level category
- “Role Coverage” = Gap, Close, Match
- Sort and filter icons for “Competency” and “Parent Category” Columns.
08. Outcomes
Overall, the client was very happy with our final MVP. We were able to successfully address the most permanent needs of the RYG tool while offering additional research and feedback towards future considerations that fell out of scope.
We relied heavily on user feedback to make decisions that aligned with our client’s needs and to direct our design choices. With more time, we would have performed additional rounds of user testing to iterate and improve the final mvp.
Solved platform needs provided by the client:
Problem: Too Much Scroll
Solution: Usability testing confirmed single page navigation provided a better user experience with avoidance of page-reload and excess scrolling. We successfully built a single screen to include employee profile data, RYG visualization and drill down data, and more without overwhelming our users with crowded content.
Problem: No Summary of Data
Solution: Testing also verified the users need for a summary of data, which we included in the “Overview” above the RYG visualization for quick visibility.
Future considerations
- Design the Summary Page – Create and test the view proceeding the RYG tool to help expedite a manager’s decision making process by providing suggested candidates for roles in a customizable dashboard setting.
- Implement a weighted system for competencies – First requires Claira to build functionality into their algorithm, but user testing confirmed it would provide value through additional at a glance context.
- Drill down column data controls – Ability to move and add additional columns by user preference.
- Multiple Employee Comparison – Allow managers to directly compare two or more candidates to a single role or a single employee between multiple roles.
- Untapped Skills View – Design and test solutions to add value to the untapped skills view in the employee profile.
Reflections
Although the project was a success, looking back I would have done some things differently.
For example, we spent a significant amount of time on RYG visualizations, resulting in less time to focus on designing and testing other tools. The convergence of a single element was difficult to finalize with 5 variations (one from each team member). If we separated into smaller groups and focused efforts on different elements, I think our resources would have been better utilized. In the future, I would advocate for divvying up the team into specified areas of work that can come together to create a cohesive design.
This project allowed me to experience the importance of time management and user feedback analysis with a real client.
Overall, I was able to exercise and expand my skill set and become a more well-versed, confident designer.